Using UP CARE's REST API as a Data Source in Grafana
If you're planning to deploy Grafana on your computer and want to use UP CARE's REST API as your data source, this guide will walk you through the necessary steps. By following these instructions, you can seamlessly integrate UP CARE's REST API with Grafana to create insightful dashboards.
Prerequisites
Before you begin, ensure you have Grafana installed on your computer. You will also need access to UP CARE's REST API with the appropriate URL and authentication credentials.
Installation of JSON API Plugin
- Install the JSON API plugin for Grafana. This plugin allows Grafana to communicate with RESTful APIs. You can install plugins through the Grafana Plugin Manager. If you're unfamiliar with plugin installation, consult the Grafana documentation for detailed instructions.
Adding UP CARE REST API Data Source
-
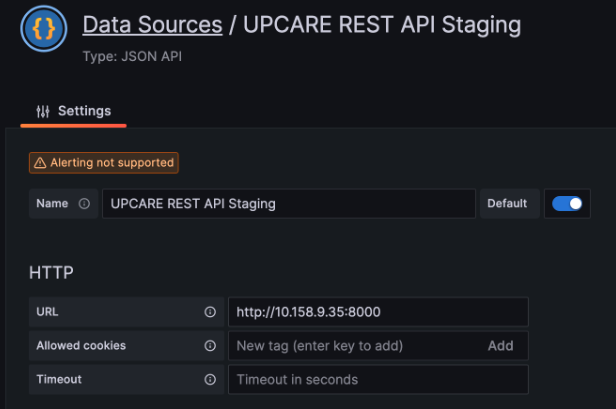
Open Grafana and navigate to the "Data Sources" section in the left sidebar.
-
Click on "Add data source" to add a new data source.
-
Choose "JSON API" as the data source type.
-
Set the URL field to the address of UP CARE's REST API, for example:
https://sync.upcare.ph. -
Configure any additional settings or authentication requirements according to your UP CARE API access permissions.
Creating a Dashboard
Once you've added the UP CARE REST API data source, you can create a new dashboard by clicking on the "Dashboard" menu item.
Adding a Panel
Create a new panel within your dashboard to display data from the UP CARE REST API. Follow these steps to create a panel:
a. Click on the "Add new panel" button.
b. In the panel editor, choose the data source you just created as the source for your panel.
c. Utilize query parameters to filter the response data based on your requirements. Detailed information on query parameters can be found in the REST API documentation provided by UP CARE.
d. Under the 'query' section, select the data source you created earlier.
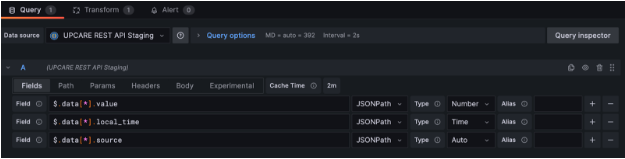
e. Configuring Fields for Data Retrieval
To retrieve data using the REST API, you'll need to specify the appropriate fields. The fields you select depend on the format of the data table you are querying. Follow the guidelines below for each format.
- Measurement Table (Long Format)
If you want to retrieve data from the measurement table (long format), use the following field configurations:
| Field | Type |
|---|---|
$.data[*].source |
Time |
$.data[*].local_time |
Auto |
$.data[*].value |
Number |
- Data Table (Wide Format)
If you want to retrieve data from the data table (wide format), specify the desired data type in the <data_type> placeholder. Use the following field configurations:
| Field | Type |
|---|---|
$.data[*].source |
Time |
$.data[*].local_time |
Auto |
$.data[*].<data_type> |
Number |
f. In the 'path' field, specify the endpoint you want to access on the UP CARE REST API, for example: /api/grafana/<your_database_name>.
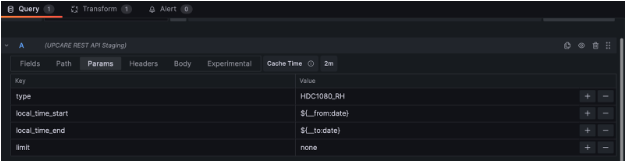
g. Using Params for Data Filtering
To refine the response data further, use the 'params' field. This allows you to dynamically filter data based on specified date ranges and other criteria using Grafana's interval variables. Follow the configurations below for each table format:
- Measurement Table (Long Format)
To retrieve data from the measurement table (long format), replace <data_type> with the specific type of data you want to filter. Use the following parameters:
| Key | Value |
|---|---|
local_time_start |
${__from:date} |
local_time_end |
${__to:date} |
type |
<data_type> |
- Data Table (Wide Format)
To retrieve data from the data table (wide format), specify the desired data type in the <data_type> placeholder. Use the following parameters:
| Key | Value |
|---|---|
table |
data |
local_time_start |
${__from:date} |
local_time_end |
${__to:date} |
columns |
local_time,source,<data_type> |
Grouping Data
-
Under the 'Experimental' section of the panel editor, you can set the 'group by' option to "source" if required.
-
Save your panel settings.
Notes
- Field Types: Ensure you are using the correct field type for your data retrieval needs. The long format typically involves separate records for each measurement, whereas the wide format involves a single record with multiple measurements.
- Dynamic Parameters: Utilize Grafana's dynamic variables, such as
${__from:date}and${__to:date}, to automate the selection of date ranges based on the user's current view.
Conclusion
By following these steps, you have successfully configured Grafana to use UP CARE's REST API as a data source and created a dashboard with panels to visualize the data. If you encounter any issues or have additional questions, please do not hesitate to reach out for further assistance. We are here to help you make the most of your Grafana integration with UP CARE's REST API.